Dashboard
Dashboard is the quickest way to see whether a workspace is actually being used and whether recent changes are affecting real traffic.
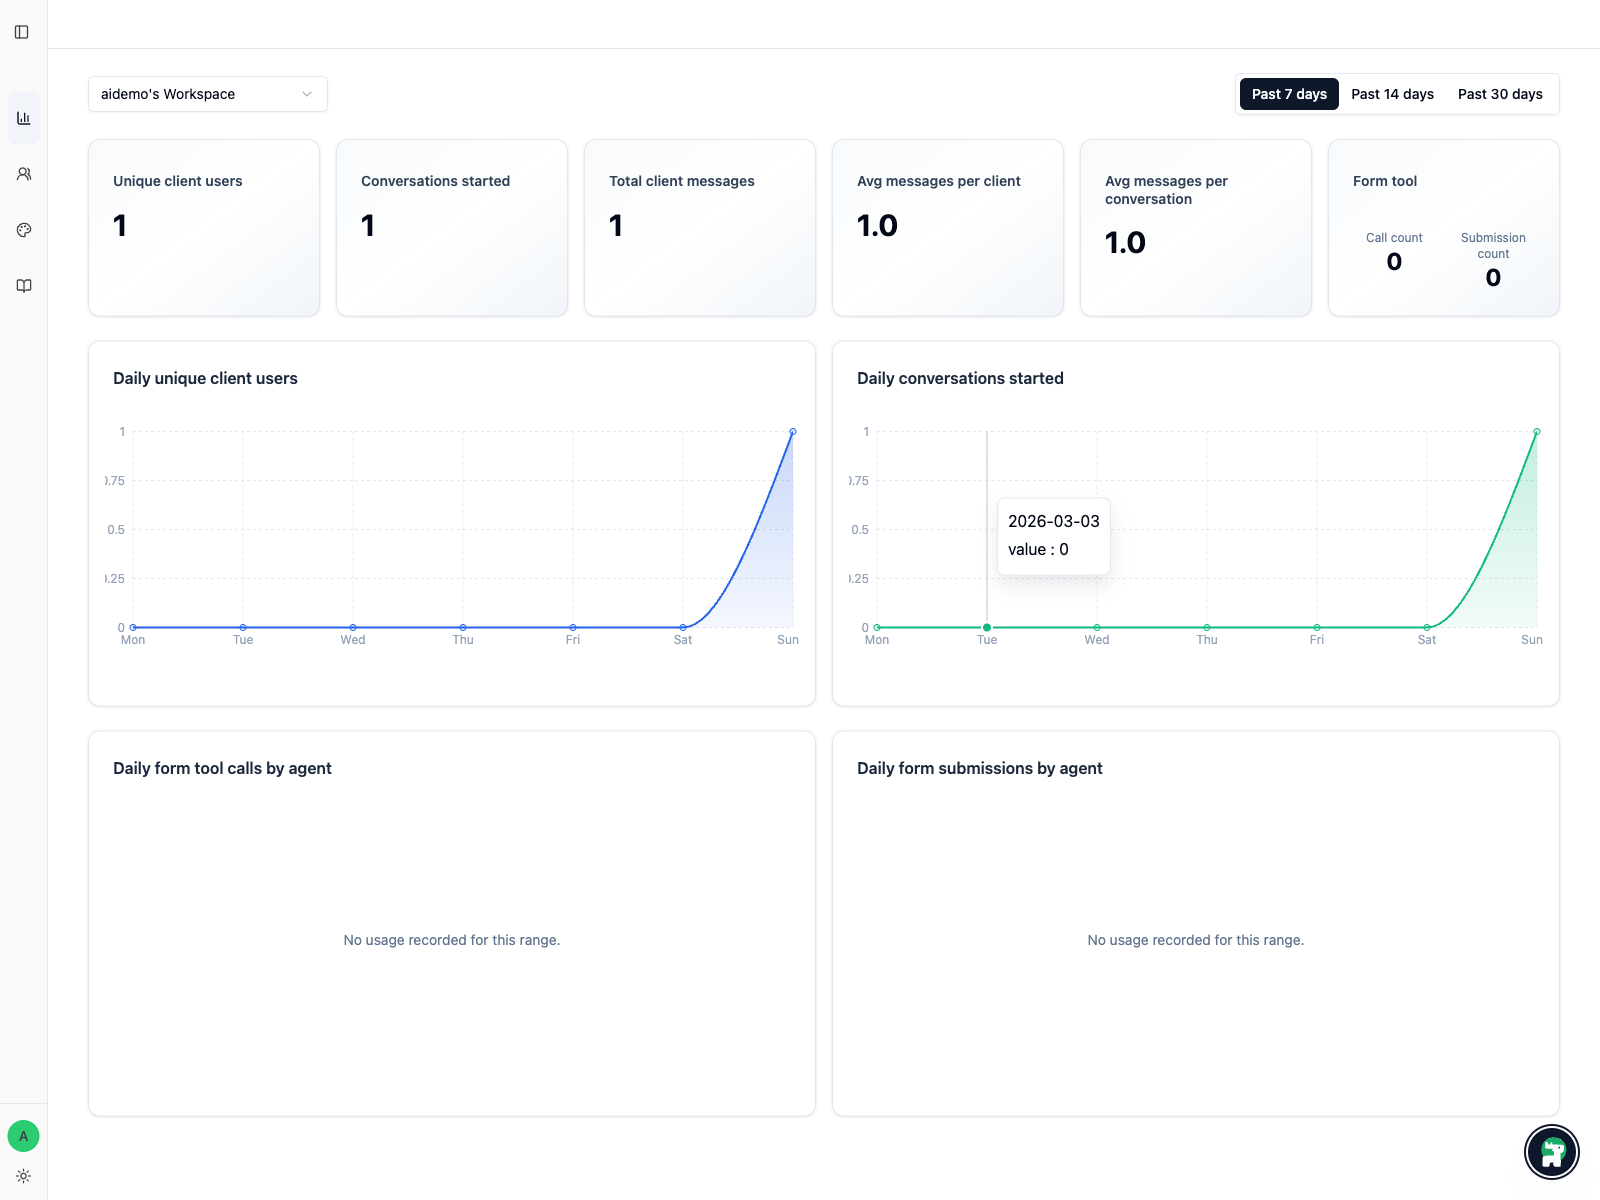
What operators look for
After a publish, operators usually watch:
- whether any client users are arriving
- whether conversations are starting
- whether message volume is rising or dropping
- whether form activity is appearing when request forms are part of the flow
Time range matters
Use the time-range switch to match the question you are asking:
Past 7 days: recent launch checksPast 14 days: short pilot reviewPast 30 days: broader adoption and trend review
How to read a quiet dashboard
A quiet dashboard is not automatically a problem.
It may simply mean:
- the rollout is still intentionally small
- the audience has not been invited yet
- the channel is live but traffic has not started
Use it together with Histories instead of treating charts alone as the full story.